Skip to main contentThe Developer Dashboard, also known as the Consumer Dashboard,
is the command center for all your API needs.
Here you can manage your API usage, top up your wallet, and view your spending history.
Lets take a look at the different sections of the dashboard.
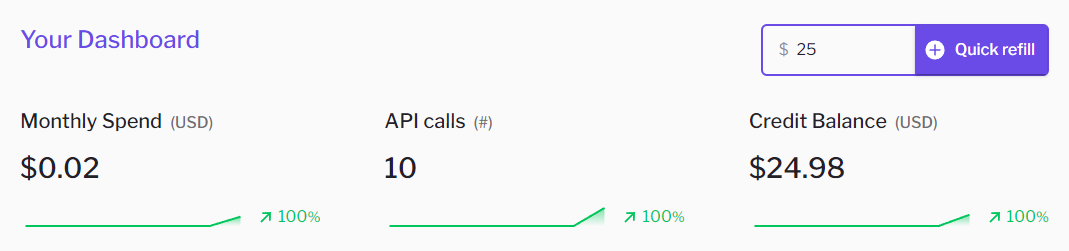
Trends
The trends section at the top of the dashboard gives you a quick snapshot of your API usage and wallet balance.
You can verify your current balance, the number of API calls, and view your spending trends.
You can also access the top-up button from here for a quick refill with your primary top-up method.
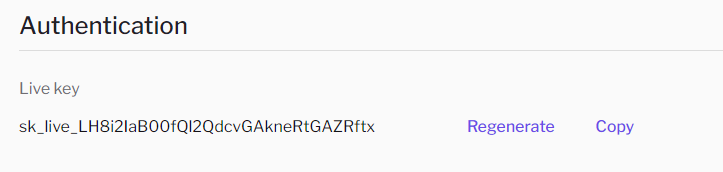
Authentication
The authentication section shows you your API key.
This API key can be used to access all the APIs on the Sulu Hub.
Make sure that you keep this key safe. If you suspect that your key has been compromised,
you can regenerate a new key by clicking on the Regenerate button.
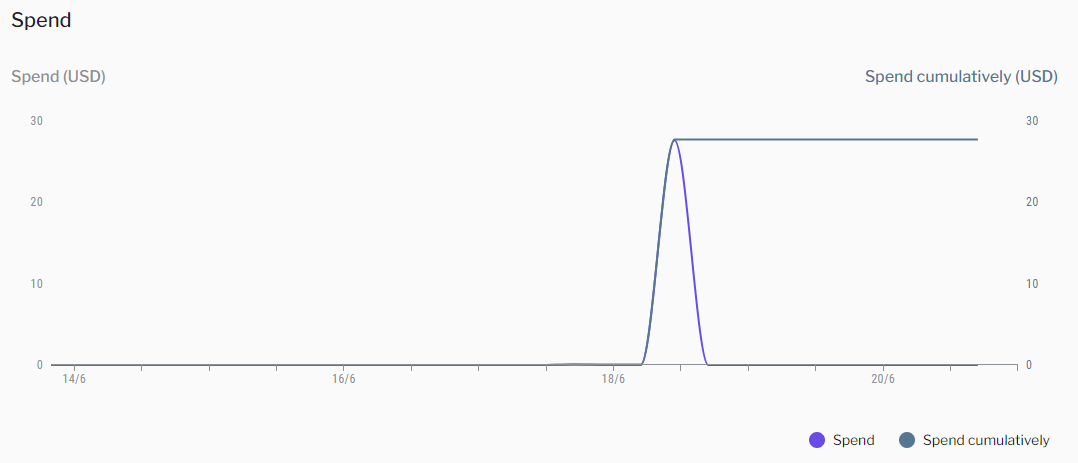
Graphs and Charts
The overview section gives you a detailed view of your API usage. It is composed of 3 charts:
- API Calls and Errors:
This chart shows you the number of successful and failed API calls over time.
The number of requests is displayed together with the ratio of errors to total calls.
For example, an error ratio of 0.5 means that 50% of your calls failed.

- Latency:
This chart shows you the average latency of your API calls over time. We make a great
effort to keep our APIs fast and responsive. If you notice a spike in latency, please
let us know so we can investigate the issue.

- Spend:
This chart shows you the amount of money you have spent on API calls over time.
It displays both the instant expenditure and the cumulative expenditure.
Filtering
You can filter the graphs by time period and APIs.
To filter by APIs you can use the dropdown menu on the top left of the Overview section.
By default, all the APIs usage and expenditure is aggregate. You can select a specific set of APIs
to view their usage and expenditure.
To filter by time period, you can use the date picker on the top right of the Overview section.
You can select a specific period to view the usage and expenditure for that period.
Feedback
We want to create the best API Hub for developers like you. This is why we
wake up everyday.
If you have any feedback or suggestions, please let us know here.
We are always looking for ways to improve our platform and make it more useful for you.